California Power Outage Map
Millions of people throughout California lost power this past October as a result of intentional blackouts designed to cut the risk of wildfires. But these utility-initiated “de-energization events” were only a fraction of the power outages in the state over the last two years.
In fact, there were more than 50,000 significant blackout events in California. Many of these customers, defined as a single utility meter serving a home or a business, likely experienced multiple outages. There’s no way to determine which ones did. But taken together the blackouts impacted the equivalent of 51 million customers.
Electrical utilities report only their total outages and the customers they affected to state regulators each year, making it hard to track day-to-day blackouts. But Bloom, working with PowerOutage.us, a company that monitors utilities throughout the country, has tracked when and where every blackout occurred in California during this sample period and how many customers it impacted. (Read about our full methodology below.)
Explore the blackout map to see each outage that affected California and search for your town. Expand to full screen for the best experience, or use the code below to embed the map on your site. For the best viewing experience, please use a supported browser (Chrome, Safari, Firefox, or Edge)
Cities Are as Vulnerable as Rural Communities
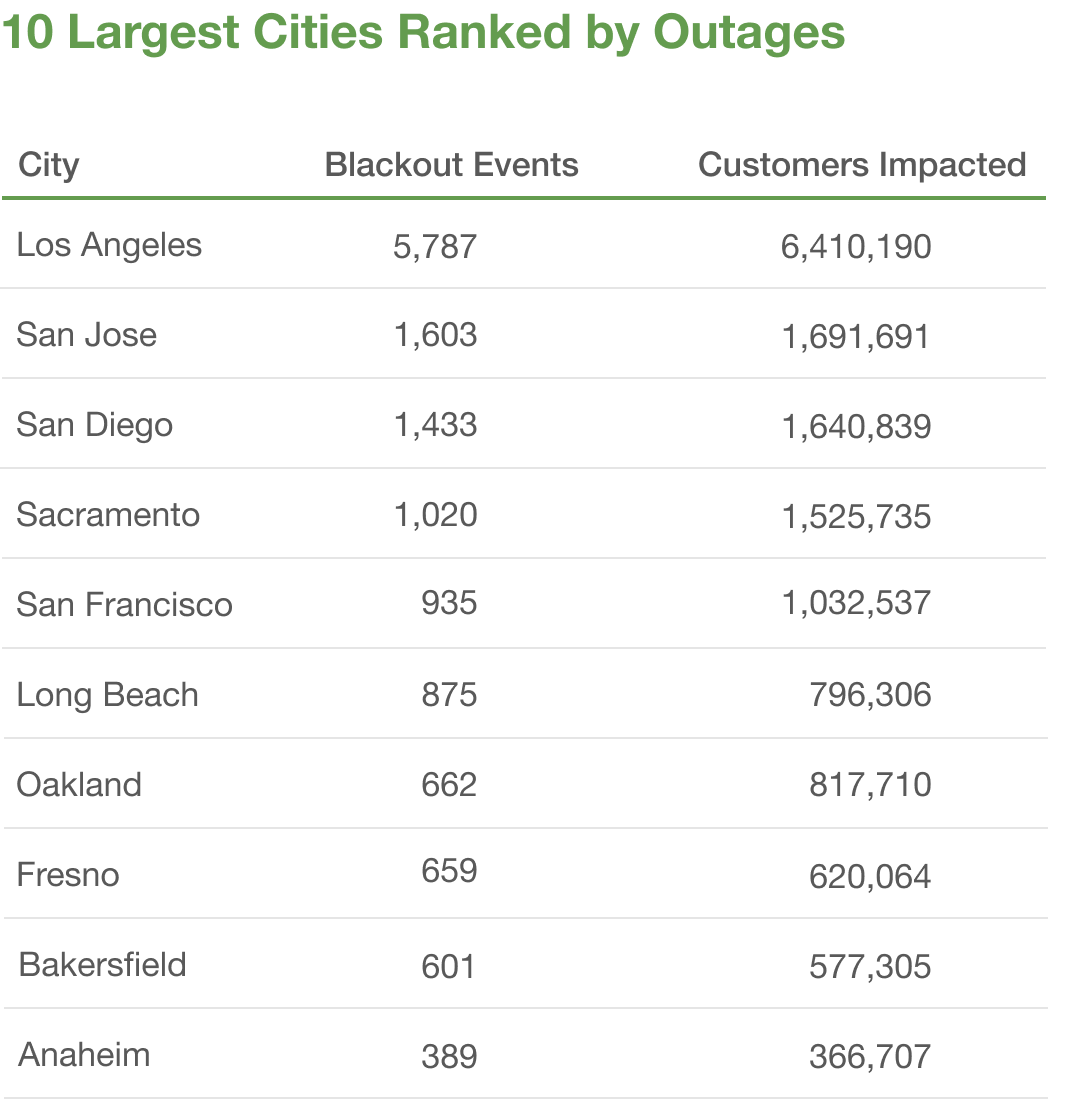
Blackouts are often thought of as a rural problem. Not anymore. California’s five largest cities—Los Angeles, San Diego, San Jose, San Francisco, and Fresno—have a combined population of more than 7.7 million people. That’s about 20% of the state’s population. For the time covered in our data set, those cities experienced 10,417 outages, affecting the equivalent of 11.4 million utility customers, which is more than 20% of the total blackout events and more than 20% of the customers impacted. Los Angeles alone accounted for 5,787 blackout events affecting the equivalent of 6.4 million utility customers.
Among California’s 25 largest cities, San Bernardino—which had 1,208 blackout events affecting the equivalent of 1.4 million utility customers—experienced the most blackouts on a per capita basis. Using customers impacted divided by population as a rough approximation of how many times a typical resident experienced a blackout, the average person in San Bernardino experienced more than 6 outages.
Still, that’s nothing compared to some small communities. Each Mill Valley resident experienced 13 blackout events by the same measure, and residents in Sonoma experienced 17.
Here are California’s 10 largest cities ranked by the number of blackout events:
The Risk of Power Outages Is Growing
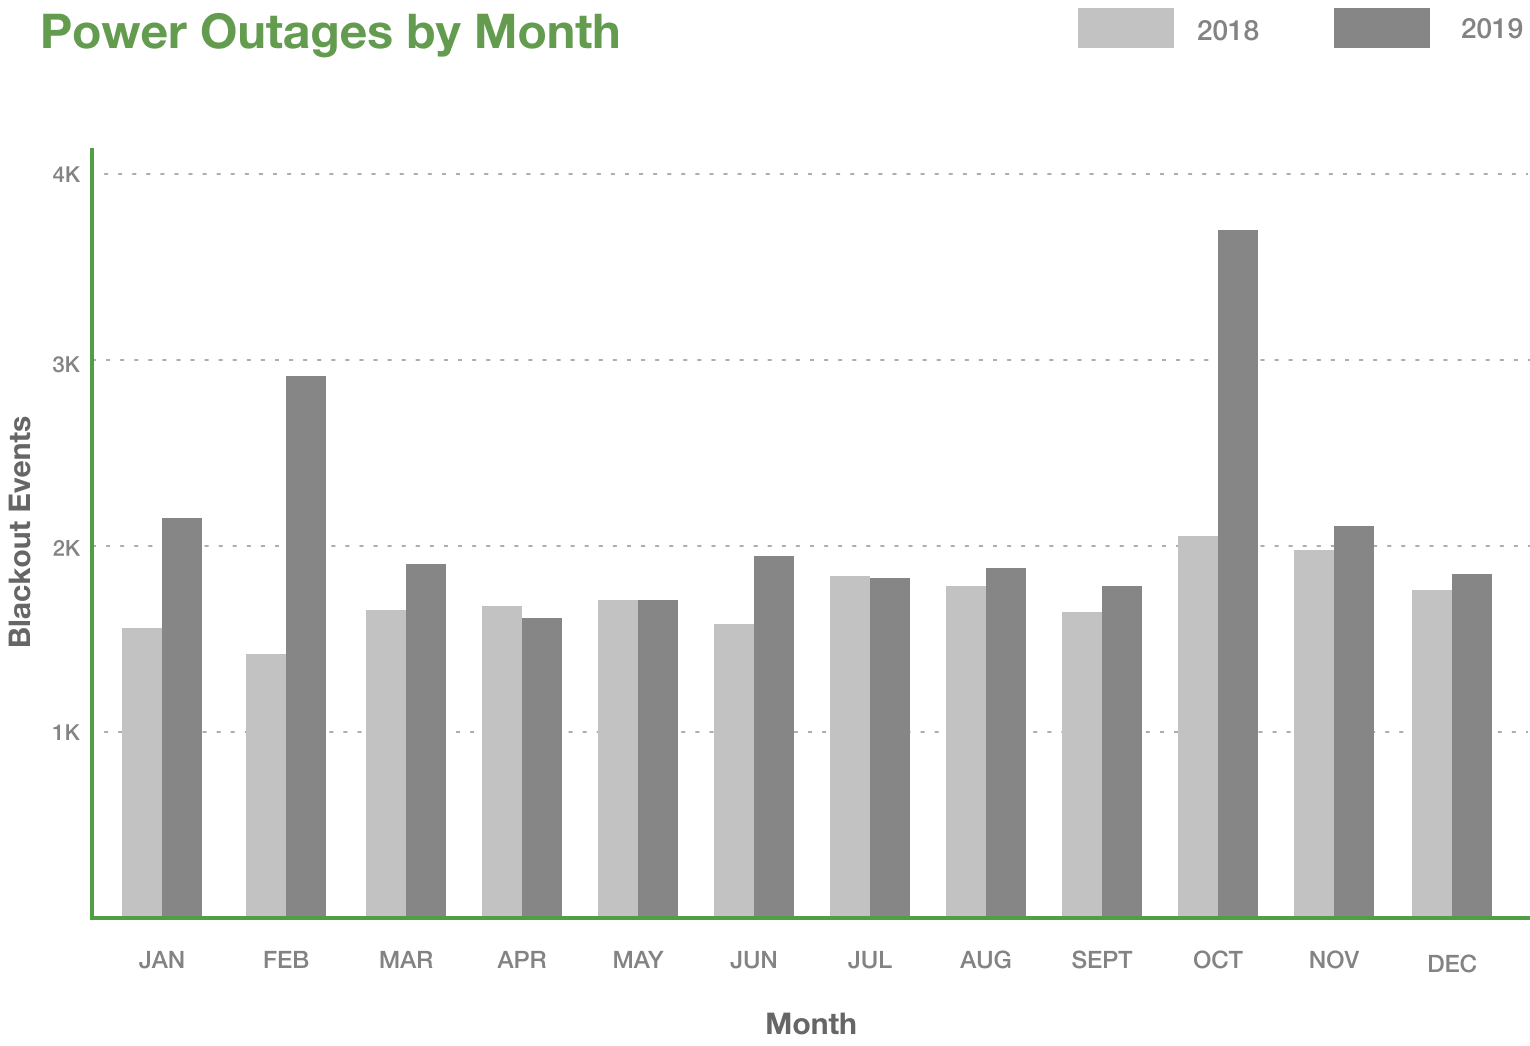
Power outages are on the rise in California. There were 25,281 blackout events in 2019, a 23% increase from 20,598 in 2018. The number of utility customers affected jumped to 28.4 million in 2019, up 50% from 19 million in 2018.
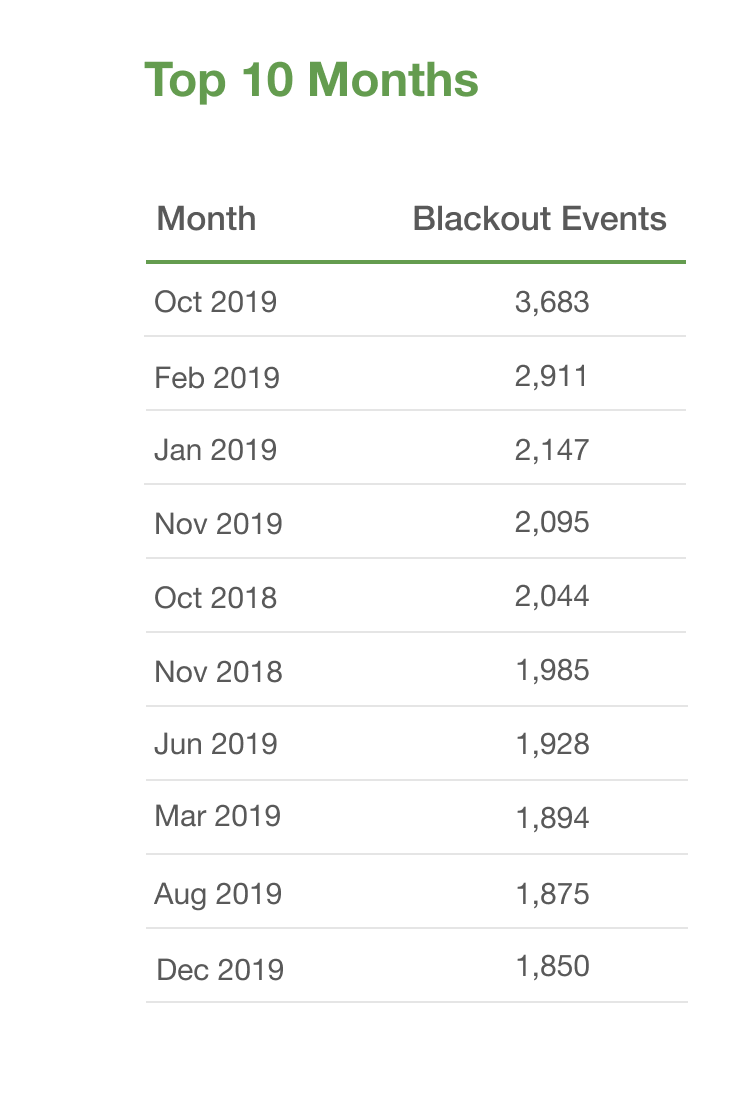
October 2019 was by far the worst month for outages. The 3,683 blackout events represented an 80% increase from a year earlier, and the 7 million customers impacted was a 204% increase. This spike occurred as utilities began implementing a program of planned power outages to prevent their lines from sparking destructive wildfires on especially hot and dry days (more on this dramatic change below). But it isn’t just the dry months when the number of blackout events in 2019 exceeded those from 2018: January was up 38%, February was up 105%, and March was up 15%.
Below are the months with the most blackout events:
The Rise of Planned Power Outages
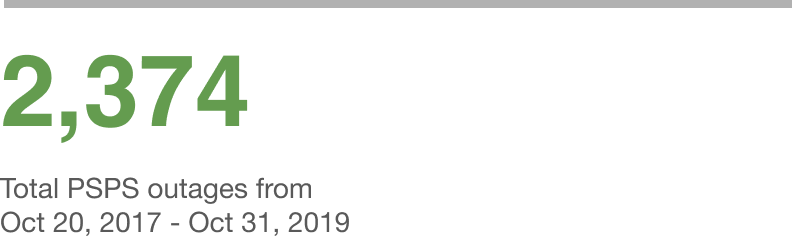
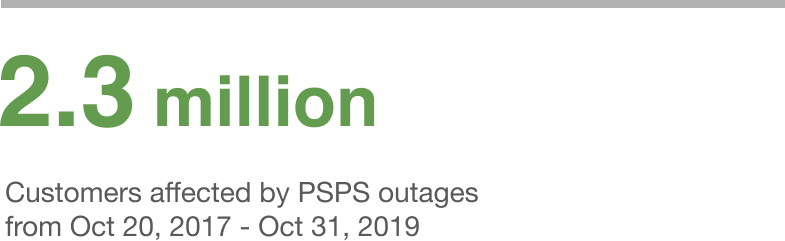
Increasingly, utilities are resorting to what they call planned de-energization events, or Public Safety Power Shutoffs (PSPSs). They usually undertake these during hot, dry days with sustained winds or strong gusts to prevent power lines from sparking wildfires and threatening human lives. According to data that state regulators require, the state’s three major investor-owned electric utilities reported a total of 2,374 PSPSs between October 20, 2017, and October 31, 2019. (Utilities report these events based on electrical circuits, not city-by-city like is tracked on the map.)
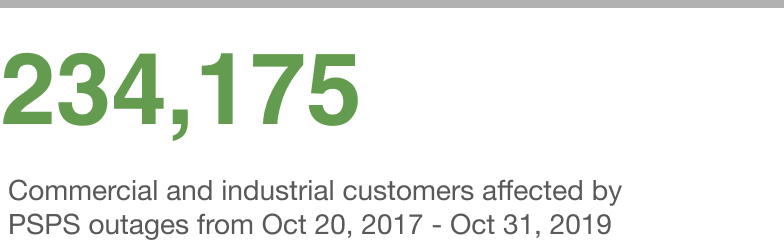
Those events, which counted for a collective 4,547 outage days during the reported period, affected an equivalent of about 2.3 million utility customers. That breaks down to nearly 2 million residential customers, a little less than a quarter million commercial and industrial customers, and about 89,000 residential medical baseline customers who require round-the-clock power for home medical care.
The longest planned de-energization event during the reported period lasted six days, but it affected relatively few customers, about 87. On the other hand, one outage that occurred over multiple circuits on October 26, 2019, affected 970,000 customers, and lasted for up to five days. The average duration of all outages was about 46 hours, or nearly two full days.

The Cost of Power Outages
Among the main causes of these power outages is an aging electricity grid that hasn’t kept up with a changing climate and evolving demands from utility customers. Energy economists are still trying to calculate the full business impact of these outages. One Stanford professor calculated that a single blackout, on October 7, 2019, likely cost small commercial and industrial businesses $2.4 billion. To further understand the scale, consider that the Department of Energy estimates yearly power outages cost the U.S. economy $150 billion annually.
Explanation of Methodology
The blackout map covers 12 major utilities and the outages that occurred in their service areas between October 15, 2017, and December 31, 2019. The data was originally collected by PowerOutage.us, a company that monitors utilities throughout the country, and then filtered to represent only outages that impacted at least 100 customers. We also combined multiple reports of blackouts on the same day in the same city into a single event. Likewise, a single outage may have affected multiple cities; we attribute that outage to each city’s outage count. Customers impacted is an aggregated count of the homes or businesses affected by the blackouts shown. Because of the map’s geocoding, in some cases a blackout event in one city may be attributed to another. In rare cases, this might produce a double count.